
✅ VWAP Percentage Levels – Precision Price Zones for NinjaTrader 8
The VWAP Percentage Levels Indicator is one of the most valuable tools in our suite — designed for serious NinjaTrader 8 traders who want to leverage institutional price benchmarks with pinpoint accuracy. By plotting percentage-based deviation levels from the prior day’s VWAP close, this indicator gives you a structured edge for entries, exits, and risk management in any market condition.
If you’re looking for a VWAP indicator for NinjaTrader that offers actionable support and resistance zones — not just averages — this tool delivers unmatched clarity and control.

Strata Vwap Percentage Levels shown on a 1 minute chart of NQ Futures
🧠 Why VWAP Percentage Levels Matter
VWAP (Volume Weighted Average Price) is already considered a core institutional metric — but most indicators only show the current day’s VWAP, leaving out deeper context.
VWAP Percentage Levels takes it further, showing you:
•Exactly how far price has deviated from yesterday’s VWAP
•Where institutional traders might enter or exit
•How to frame your trade with precise percentage zones that most traders never see
This is VWAP with structure, built for precision trading.
⚙️ Key Features of VWAP Percentage Levels
🔸 Prior Day VWAP Anchoring
Instead of resetting intraday, the indicator references the previous day's VWAP close, giving you a rock-solid foundation for interpreting today’s price action relative to institutional volume averages.
🔸 0.25% to 4.00% Percentage Gradients
Automatically plots percentage deviations in 0.25% increments, both above and below VWAP. Use them to:
Set clear profit targets and stop-loss levels
Gauge mean reversion or breakout distance
Build structured zones for reactivity
🔸 Visual Hierarchy of Levels
Whole percentages (1%, 2%, 3%, 4%) are visually distinct from fractional increments. This helps you immediately identify major price thresholds while still seeing microstructure.
🔸 Fully Customizable Style
Choose your own color scheme for positive/negative levels
Adjust opacity and line thickness
Select between solid, dashed, or dotted line styles
Everything adapts to your personal trading environment.
Everything adapts to your personal trading environment.
🔸 On-Chart Labels for Every Level
Every line is clearly labeled with its exact percentage from VWAP. No guesswork — just clean, accurate price context at a glance.
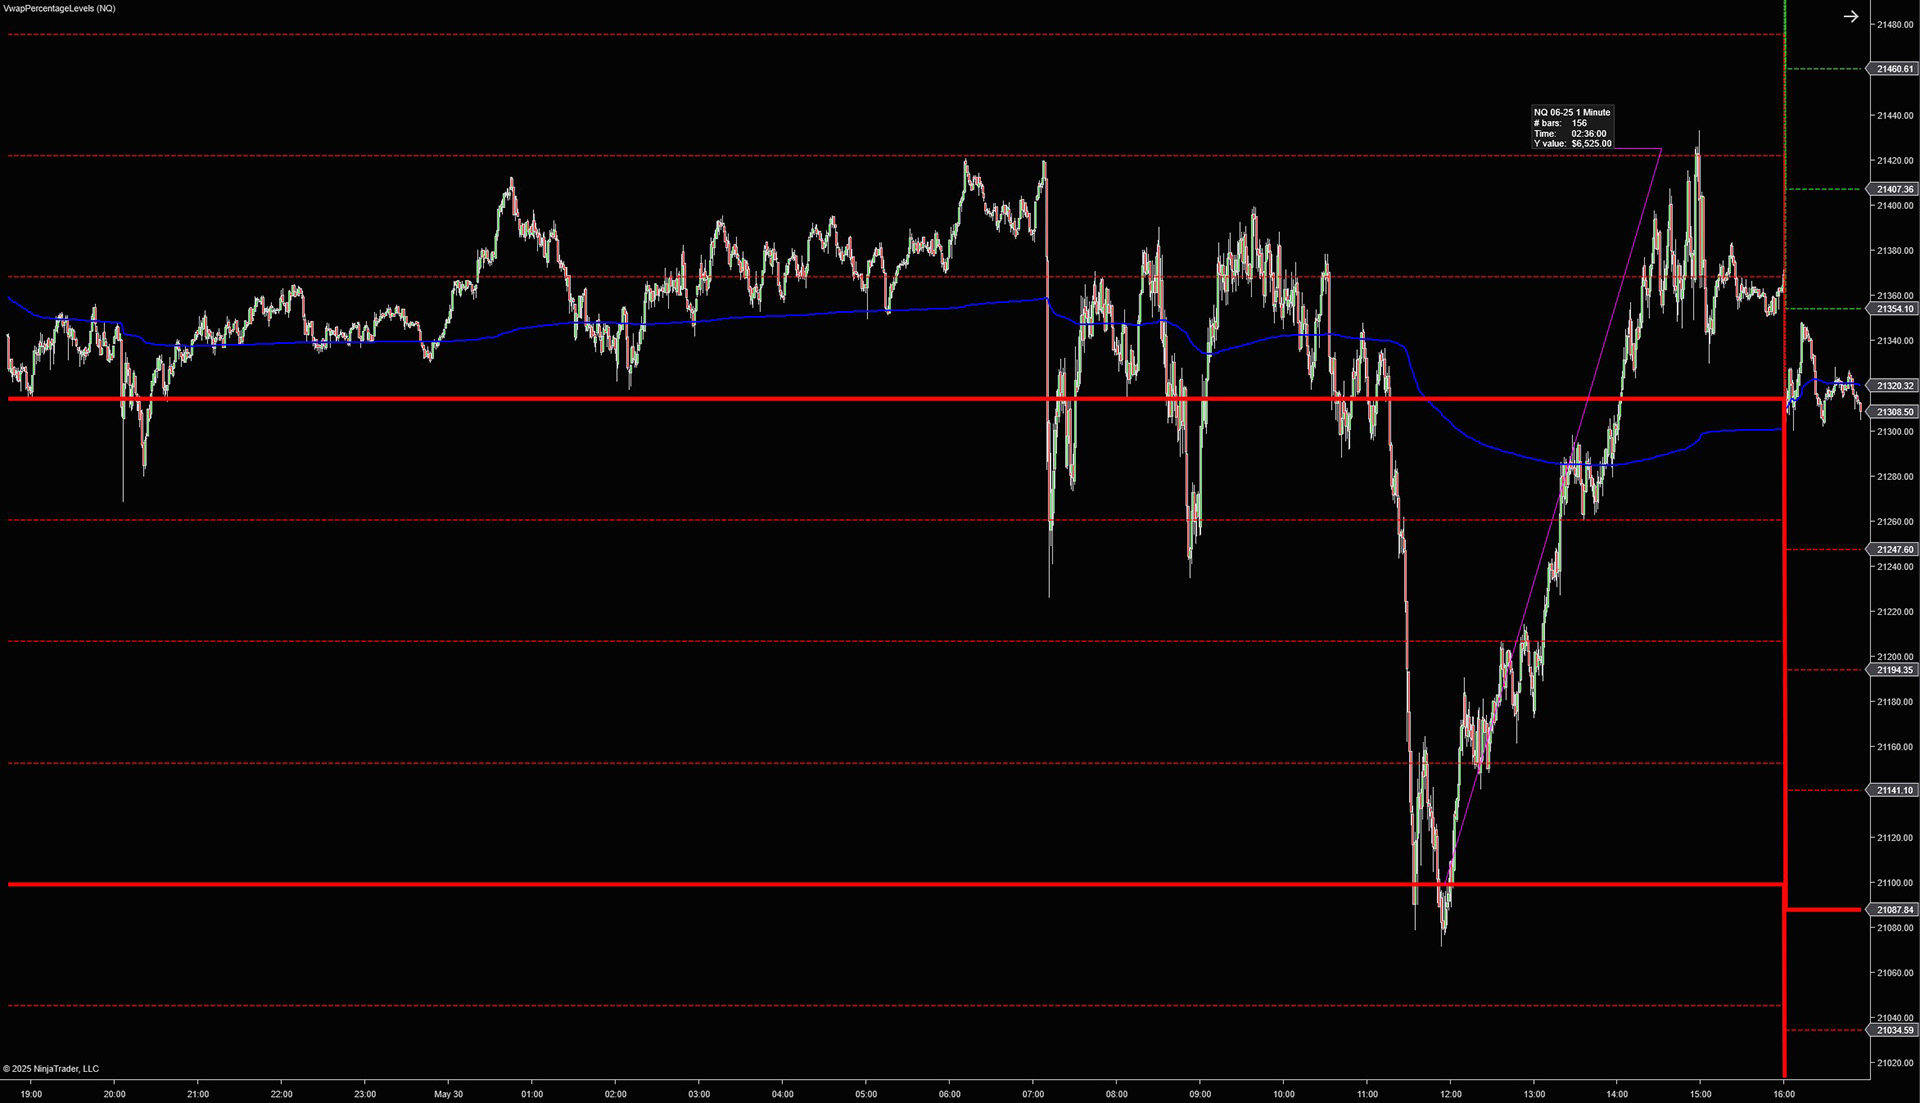
Strata Vwap Percentage Levels demonstrated on a chart of NQ Futures, showing a $6500 reversal from a -2% level
How Professional Traders Use VwapPercentageLevels
Example trade shown above on a 1 minute chart of NQ utilizing Vwap Percentage Levels for defined risk management and profit taking
Mean Reversion Strategies
When price extends too far from VWAP (typically 2% or more), institutional traders often look for mean reversion opportunities. VwapPercentageLevels gives you the exact percentage extensions to watch for these high-probability reversal zones.
Breakout Confirmation
When price breaks through a significant percentage level (like 1% or 2%), it often signals continued momentum in that direction. The clear visualization of these thresholds helps you identify and confirm genuine breakouts from false moves.
Risk Management Framework
The percentage-based approach creates a natural framework for risk management. For example, you might enter a trade at the 0.5% level with a stop at the 1% level and targets at VWAP or the opposite 0.5% level.
Volatility Assessment
The relationship between price and the percentage levels gives you immediate insight into market volatility. When price rapidly crosses multiple percentage levels, you know volatility is increasing—a crucial insight for adjusting your trading approach.
📈 Who Should Use VWAP Percentage Levels?
This indicator is perfect for:
•Day traders seeking high-precision entry/exit zones
•Swing traders who want institutional context without clutter
•Prop firm challengers needing tight structure and consistency
•Any NinjaTrader 8 user looking to trade with rules, not intuition
Use VWAP Percentage Levels alongside Strata-Levels or Level-Force for a complete structure + momentum confirmation setup.

Strata Vwap Percentage Levels shown on a 1 minute chart of YM Futures
🛠️ Requirements and Technical Specifications
•Compatible with: NinjaTrader 8
•Markets: Works with all markets and timeframes
•Calculation: Based on Volume Weighted Average Price (VWAP)
•Reference: Uses prior day's VWAP close as the baseline
•Range: Displays percentage levels from 0.25% to 4.00% in both directions
•Visual customization: Fully adjustable colors, opacity, thickness, and line styles
✅ Trade VWAP Like an Institution
If you’re relying on raw VWAP or lagging zones, it’s time to upgrade. The VWAP Percentage Levels indicator turns price deviation into a powerful tool for structured trades. Get clear confluence zones, sharp entries, and consistent exits — without clutter or guesswork.
This is VWAP with precision.
Disclaimer: Vwap % Levels and all associated indicators are charting tools intended for informational and educational purposes only and does not constitute trading advice. Please consult a licensed financial advisor before making any investment decisions. Trading involves risk, and you are solely responsible for your own decisions. Use this indicator at your own risk.